Splunk App v2.0.0 - Installation and Configuration Guide
The VMware Carbon Black Cloud App for Splunk is a single application to integrate your endpoint and workload security features and telemetry directly into Splunk dashboards, workflows and alert streams.
This application connects with any Carbon Black Cloud offering and replaces the existing product-specific Carbon Black Cloud apps for Splunk. This app provides a unified solution to integrate Carbon Black Cloud Endpoint and Workload offerings with Splunk Enterprise, Splunk Cloud, and Splunk Enterprise Security (ES). Out-of-the-box, this app provides holistic visibility into the state of your endpoints and workloads through customizable dashboards and alert feeds in Splunk.
Quick Links
- App Setup and Configuration
- FAQ & Troubleshooting
- Splunk v2.0.0 Video Walkthrough
- Release Notes
- Support
- User Guide
- Useful Splunk Queries
Requirements
- Splunk Enterprise 9.0, 9.1 or Splunk Cloud
- Splunk CIM Add-on
Upgrading to v2.0.0
Before Upgrading to v2.0.0
-
If you have a non-production instance of Splunk, upgrade that first.
-
Identify if you have any custom content that uses alert metadata, such as reports, searches, or dashboards.
- If the content is using a non-CIM and non data model field, review the Migration Guide. Many renamed fields have been aliased to their old values. However, Splunk content based on fields that were removed or were replaced by multiple fields will need to be updated.
- If the field is marked as DEPRECATED then the field no longer exists. Choose a different field or remove that field from your custom content.
- If the field has a replacement field identified then update to use that field name instead.
- All fields now available on the Data Forwarder Alert Schema v2 are here
- If the content is using a non-CIM and non data model field, review the Migration Guide. Many renamed fields have been aliased to their old values. However, Splunk content based on fields that were removed or were replaced by multiple fields will need to be updated.
Note: Since the Alerts v7 schema contains more metadata, customers may see an increase in alert size by up to 2x. However, since Observed alerts were removed, customers are likely to see a net decrease in overall storage required for CB Analytics alerts (up to 10x decrease), but a net increase in other alert types such as Watchlist (up to 2x increase).
-
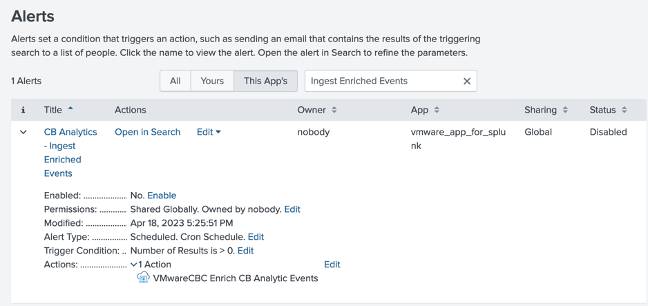
If there are any Splunk alerts using the
Process GUID DetailsorVMwareCBC Enrich CB Analytic Eventsalert actions, review why they were configured and the data that is used.- In the CBC Splunk app v1.x, many customers used these to get context not available in alerts, such as process & parent process information.
- The alert metadata included in both Alert v7 API and Data Forwarder Schema v2 has been improved and you may no longer need to run these alert actions.
- If you determine it is no longer necessary to automate these alert actions, disable or remove the Splunk Alert.
This image shows the configured action.
-
If you are using any of the Live Response alert actions - List Process or Kill Process - the API Key must be changed. Before upgrading, update your existing Splunk access level to include the required permissions.
a. In the Splunk App, identify the API key (Access Level type is Custom) you use for other Splunk inputs and actions, such as the Alerts input.
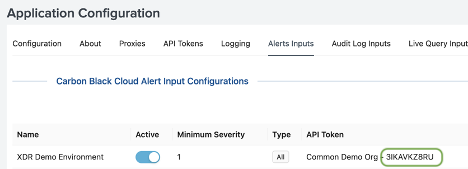
b. In the Carbon Black Cloud console identify the access level you use for that API key by going to Settings > API Access, finding the API ID and reading the Access Level.
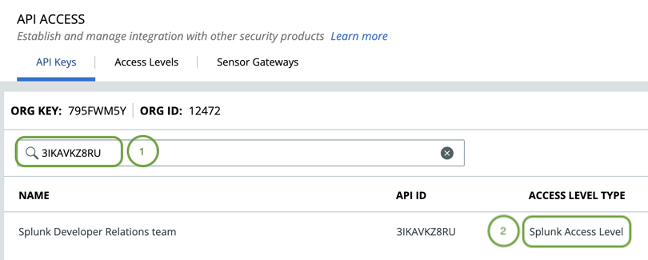
c. Add Live Response permissions to that Access Level.
- Go to Settings > API Access > Access Levels tab
- Find and edit (click the pencil icon) that access level
- Add the following permissions for Kill Process and List Process if you want to continue to enable those actions.
The full permissions are in Table 2.
* Kill Process requires: * device - READ * org.liveresponse.session - CREATE, READ, DELETE * org.liveresponse.process - READ, DELETE * List Processes requires: * device - READ * org.liveresponse.session - CREATE, READ, DELETE * org.liveresponse.process - READ -
If you are using an
Audit Loginput then the API key MUST be changed to a custom access level key with audit log permissions by October 31, 2024. Before upgrading, update your existing Splunk access level to include the required permissions.a. Before upgrading, follow the steps listed above in the Carbon Black Cloud console to add the
org.auditspermission to the Custom Access Level being used by the API key you’re using in Splunk.
The full permissions are in Table 1.b. Note: When the API key has the audit log permission added, three days of audit logs will be ingested using that key. There may be three days of duplicate audit log data collected by Splunk when switching API keys.
-
If you are you an Enterprise EDR customer, decide whether to ingest Authentication Events collected by Carbon Black Cloud into Splunk.
Installing v2.0.0
In Splunk:
- Navigate to Managing Apps
- Find
VMware Carbon Black Cloud - In the version column click
Update to 2.0.0
After Upgrading to v2.0.0
-
If you are using the Live Response List or Kill Process actions the API key must be changed.
a. In the Splunk App go to the Administration > Application Administration Page > Alert Actions tab.
b. Deselect the old API Token and select the API Token using the Access Level you updated in Step 4 of What to do before upgrading to v2.0.0.

-
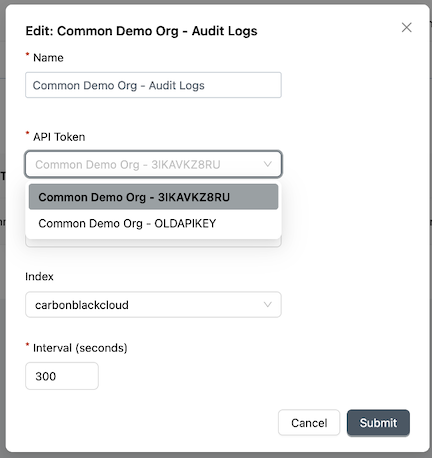
If you are using an audit log input the API key must be changed.
a. In the Splunk App go to the Administration > Application Administration Page > Audit Log Inputs Tab.
b. After upgrading, update the API Token used in the audit log input to the Custom type API key you updated in Step 5 of What to do before upgrading to v2.0.0.
Note: When the API key has the audit log permission added, three days of audit logs will be ingested using that key. There may be three days of duplicate audit log data collected by Splunk when switching API keys. -
If you are you an Enterprise EDR customer, you can take ingest Authentication Events collected by Carbon Black Cloud into Splunk
a. In the Carbon Black Cloud Console:
- Ensure Enterprise EDR is enabled
- Ensure Auth Event collection is enabled in relevant policies. See the Carbon Black Cloud User Guide for steps to enable Auth Event Collection.
b. In the Splunk App go to the Administration > Application Administration Page > Auth Event Inputs tab.
- Configure as per the
Auth Eventssection of the Built-in Input Configuration Guide.
c. For more information:
- Read the XDR announcement blog
- Discover the fields available in Auth Events on the Search Fields - Investigate page.
-
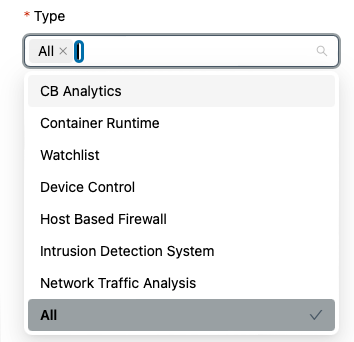
Configure the types of Alerts to ingest if you are using the API ingest option.
- Version 2.0.0 of the app can ingest the new types of alerts from Carbon Black Cloud.
- In the Splunk App go to the Administration > Application Administration Page > Alerts Inputs Tab.
- Choose the types of Alerts to ingest.
Allcan be selected. - You may see the Alert Type
Bothafter upgrading the app.Bothmeans CB Analytics and Watchlist alert types, the only two that were supported in App version v1.x.
Verify after data ingest
-
Verify that custom content that uses alert metadata, such as reports, searches, or dashboards is populating correctly.
If data is missing, verify the mappings have been updated:
- Current supported fields for Alerts v7 API are here
- Ensure all mapped fields align to the Data Forwarder Alert Schema v2 are here
- If the field is marked as DEPRECATED then the field no longer exists. Choose a different field or remove that field from your custom content.
- If the field has a replacement field identified then update to use that field name instead.
-
If you are using any of the Live Response alert actions - List Process or Kill Process - verify the actions execute correctly.
- Check the Administration > Application Health Overview for errors.
- If a 401 or 403 error occurs there is a problem with the API Key Configuration.
- Verify the Access Level in Carbon Black Cloud has the permissions for each action as per Table 2.
- Verify the Splunk Configuration uses the API Key that has been assigned the Access Level in the previous step
-
If you are using an audit log input, verify Audit Logs are being ingested.
- Check the Administration > Application Health Overview for errors.
- If a 401 or 403 error occurs there is a problem with the API Key Configuration.
- Verify the Access Level in Carbon Black Cloud has the permissions for each action as per Table 2.
- Verify the Splunk Configuration uses the API Key that has been assigned the Access Level in the previous step
-
Check other inputs are being ingested correctly
- Check the Administration > Application Health Overview for errors.
- Use the Troubleshooting and Frequently Asked Questions.
Deployment Guide
Warning: Installing the VMware Carbon Black Cloud Technology Add-on (TA) or Input Add-on (IA) on the same node as the App is an unsupported configuration that may result in instability or errors.
Depending on your Splunk configuration and version, the VMware Carbon Black Cloud app, Technology Add-on (TA), and Input Add-on (IA) need to be installed on specific Splunk instances. See the following sections as to where each component is installed.
-
Single Instance (8.x) or (9.x)- (Pre-requisite) Splunk CIM Add-on
- Only the VMware Carbon Black Cloud App (vmware_app_for_splunk)
-
Single Instance + Heavy Forwarder (8.x) or (9.x)- Single Instance:
- (Pre-requisite) Splunk CIM Add-on
- VMware Carbon Black Cloud App (vmware_app_for_splunk)
- Heavy Forwarder: IA-vmware_app_for_splunk (IA-vmware_app_for_splunk)
- Single Instance:
-
Distributed deployment (8.x) or (9.x)- Heavy Forwarder: IA-vmware_app_for_splunk (IA-vmware_app_for_splunk)
- Search Head:
- (Pre-requisite) Splunk CIM Add-on
- VMware Carbon Black Cloud App (vmware_app_for_splunk)
- Indexer: TA-vmware_app_for_splunk (TA-vmware_app_for_splunk)
-
Splunk Cloud- Depending on your Splunk Cloud configuration you may need to contact Splunk Cloud Support to install the VMware Carbon Black Cloud app. Otherwise, see the Self Service Install documentation
Distributed App Configuration
In a distributed environment the app and add-ons only support a subset of configuration as each Splunk component provides specific functionality.
The Heavy Forwarder is where Splunk will ingest data from the Carbon Black Cloud, the Indexer will process the incoming data and apply the CIM compliant models, and the Search Head provides the graphical search interface that allows you to interact with the data through dashboards, alert actions and custom commands.
-
Search Head -
vmware_app_for_splunk- VMware CBC Base Configuration
- Proxies
- API Token Configuration
- Alert Actions
- Custom Commands
-
Heavy Forwarder -
IA-vmware_app_for_splunk- Proxies
- API Token Configuration
- Built-in Inputs (Alert Inputs, Audit Log Inputs, Auth Events, Live Query Inputs, and Vulnerabilities Inputs)
Note: If you are using the Data Forwarder to ingest Alerts and Events then you will need to install and configure the Splunk AWS Add-on.
- Indexer -
TA-vmware_app_for_splunk- No additional configuration needed beyond installation for CIM compliant models
App Setup and Configuration
An updated Setup Video with in depth walk through of the following sections will be published shortly.
The earlier version is still available, however some configuration has changed per the release notes for version 2.0.0.
The VMware Carbon Black Cloud App offers two methods to ingest data. Each method supports a subset of the Carbon Black Cloud data which is outlined below.
Built-In Input
- Use the VMware Carbon Black Cloud App (or Input Add-on via a Heavy Forwarder), which leverages VMware Carbon Black Cloud REST APIs to pull data into Splunk
- Supported Data
AlertsAudit LogsAuth EventsLive Query ResultsVulnerabilities
Data Forwarder
- Streams data into an AWS S3 bucket at scale
- Uses the AWS Add-on for Splunk to pull the data from AWS S3 into Splunk
- Supported Data
AlertsRecommended for orgs with high volumesEndpoint.EventsWatchlist.Hit
Authentication & Authorization
For built-in data inputs, alert actions, and commands, create an API Key with the correct permissions in the Carbon Black Cloud and then configure Splunk to use those keys.
-
Identify the built-in
data inputs,alert actions, andcommandsyou intend to use. -
Reference Tables 1, 2, and 3 below to identify the required RBAC Permissions. Starting with App Version 2.0.0 all inputs and actions use an Access Level of type custom, so only one API key is required. (For multi-tenancy configurations, this is one API Key per org.)
-
If Identity is managed in Carbon Black Could: Generate API Keys in the Carbon Black Cloud console under
Settings–>API Access. Refer to the VMware Carbon Black Cloud Authentication Guide for additional guidance.-
Access LevelAll functions require an Access Level Type
Custom. Create a Custom Access Level with the permissions required for the Inputs and Actions you want to use. The tables below list the necessary permissions that must be included in your Custom Access Level for each Action. -
API KeysStarting with App Version 2.0.0 all inputs and actions use an Access Level of type custom, so only one API key is required. (For multi-tenancy configurations, this is one API Key per org.)
Create one API key with Access Level set to
Custom, then select the Access Level you created in step 1.Earlier versions made use of Access Level types
Live ResponseandAPI. See What to do before upgrading to v2.0.0 for details on how to update. -
ORG KEYRemember your organization’s Org Key from the top of the API Keys table for later steps.
-
-
In
Splunk, navigate to theAdministration–>Application Configurationmenu in theVMware Carbon Black Cloud App.-
On the
API Token Configurationtab, create a new API configuration by clicking the+in the top right corner. -
Give the configuration meaningful API Name and Organization Name. You’ll use this to configure built-in Inputs and Actions.
-
Enter the Org Key, API ID, and API Secret Key from step 3 (or 4).
-
The CBC Environment is the hostname of the Carbon Black Cloud console your organization is provisioned e.g.
defense.conferdeploy.net.
Repeat steps 2-4 for each API Key you created from step 3 or 4. From App v2.0.0 onwards, the only time more than one API key is required is for multi-tenant configurations. In this case one API Key for each Carbon Black Cloud tenant is required.
-
Access Levels & Permissions
All built-in inputs and actions require an API Key with an Access Level of type CUSTOM. This changed in App v2.0.0; earlier versions used other Access Levels of type LIVE_RESPONSE and API.
The following tables indicate the permissions that are required.
Table 1: API Data Inputs
| Inputs | Description | Permissions | Data Schema |
|---|---|---|---|
Alerts |
Alerts indicate suspicious behavior and known threats in your environment. Use the Data Forwarder option instead when you have a high volume or significant bursts as the Data Forwarder provides higher scalability. | orgs.alerts (Read) |
Alert Schema |
Auth Events |
Auth Events API provides visibility into authentication events that occur on Windows endpoints. | org.search.events (Read, Create) |
Auth Event Schema |
Live Query Results |
LiveQuery Run and Result data. Requires VMware Carbon Black Cloud Audit & Remediation | livequery.manage (Read) |
LiveQuery Result Schema |
Vulnerabilities |
Vulnerability assessment data including identified CVEs, metadata, and impacted assets. Requires VMware Carbon Black Cloud Workload Protection | vulnerabilityAssessment.data (Read) |
Vulnerabilty Schema |
*Audit Logs |
Carbon Black Cloud Audit Logs, such as when a user signs-in or updates a policy | org.audits (Read) |
Audit Log Schema |
* Note: Audit Logs changed from an Access Level type of `API` or `LIVE_RESPONSE` to `CUSTOM` in Splunk App v2.0.0
Table 2: Alert Actions/Adaptive Responses
All built-in inputs and actions require an API Key with an Access Level of type CUSTOM. This changed in App v2.0.0; earlier versions used other Access Levels of type LIVE_RESPONSE and API for some actions.
The following tables indicate the permissions that are required.
| Alert Action | Description | Permission |
|---|---|---|
Add IOCs to a Watchlist |
Adds specified IOC(s) to a specified report in a watchlist. Requires VMware Carbon Black Cloud Enterprise EDR | orgs.watchlist (Create, Read, Update) |
Ban Hash |
Prevents a sha256 hash from being executed in Carbon Black Cloud. | org.reputations (Create) |
*Close Alert |
Closes the specified alert in Carbon Black Cloud | org.alerts (Read)org.alerts.close (Execute) |
Get File Metadata |
Retrieves file metadata, such as the number of devices the hash was observed on, from the specified sha256 file hash. Requires VMware Carbon Black Cloud Enterprise EDR | ubs.org.sha256 (Read) |
*Kill Process |
Remotely kills a process on the devices specified in the search | device (Read)org.liveresponse.session (Create, Read, Delete)org.liveresponse.process (Read, Delete) |
*List Processes |
Remotely lists processes on the specified device. Example: If an Analytics alert did not terminate the process, identify if the suspicious process is still running on the device. | device (Read)org.liveresponse.session (Create, Read, Delete)org.liveresponse.process (Read) |
Process GUID Details |
Fetches the most up to date, detailed metadata associated with the specified process GUID. Example: learn more about the process that triggered a Watchlist alert, such as parent and process cmdline Example: learn more about the process that triggered a Watchlist alert. | org.search.events (Read, Execute) |
Quarantine Device |
Quarantines the specified device and prevents suspicious activity and malware from affecting the rest of your network. The device can only communicate with Carbon Black Cloud until unquarantined | device (Read)device.quarantine (Execute) |
Remove IOCs from a Watchlist |
Removes IOCs from a report in a watchlist. Requires VMware Carbon Black Cloud Enterprise EDR | orgs.watchlist (Read, Update, Delete) |
Run Livequery |
Creates a new LiveQuery Run. Example: Automatically get the logged in users on an endpoint after a credential scraping alert. Requires VMware Carbon Black Cloud Audit & Remediation | device (Read)livequery.manage (Create, Read) |
Un-quarantine Device(s) |
Removes the specified device(s) from the quarantined state, allowing them to communicate normally on the network. | device (Read)device.quarantine (Execute) |
Update Device Policy |
Updates the policy associated with the specified device. Example: move a device to a more restrictive policy during incident investigation | device (Read)device.policy (Update) |
Enrich Alert Observations |
Searches and ingests the Observations that are associated with the alert. Intended for use with the “Enrich CB Alert Observations” Splunk Alert. | org.search.events (Create, Read) |
Enrich CB Analytic Events (Deprecated with Deactivation date of September 5, 2024) |
Searches and ingests the Enriched Events that are associated with the CB Analytics alert. Intended for use with the “CB Analytics - Ingest Enriched Events” Splunk Alert. Requires VMware Carbon Black Cloud Endpoint Standard | org.search.events (Create, Read) |
* Note: Kill Process changed from an Access Level type of `LIVE_RESPONSE` to `CUSTOM` in Splunk App v2.0.0
* Note: List Processes changed from an Access Level type of `LIVE_RESPONSE` to `CUSTOM` in Splunk App v2.0.0
* Note: Dismiss Alert was changed in v2.0.0 to Close Alerts.
Table 3: Commands
All commands require an API Key with an Access Level of type CUSTOM. This changed in App v2.0.0; earlier versions used other Access Levels of type LIVE_RESPONSE and API.
The following tables indicate the permissions that are required.
| Command | Description | Permission |
|---|---|---|
VMware CBC Device Info (cbcdvcinfo) |
Gets real-time information about a CBC device. See Custom Commands section below for usage and best practices | device (Read) |
VMware CBC Hash Info (cbchashinfo) |
Gets real-time information about a sha256 hash, such as the number of devices that observed the file. Requires Enterprise EDR. | ubs.org.sha256 (Read) |
| VMware CBC Query (Alert Details dashboard: Alert History tab) | Loads a timeline view of the alert, including when it was created, determination changes, workflow updates, notes, and MDR comments | org.alerts (READ) |
| VMware CBC Query (Alert Details dashboard: Observations tab) | Loads Carbon Black Cloud Observations related to an alert. Only certain alert types, such as CB Analytics, Host Based Firewall, and Intrusion Detection System, have Observations. | org.search.events (CREATE, READ) |
Built-in Input Configuration
Ensure that you have correctly deployed the Apps and/or Add-ons per the Deployment Guide before attempting any configuration.
-
Create two Event index(s) for your data.
- One index for the Carbon Black Cloud data e.g.
carbonblackcloud - One index for the results of the Alert Actions e.g.
carbonblackcloud_actions
For instructions on creating an Index see the Splunk documentation
- One index for the Carbon Black Cloud data e.g.
-
Navigate to the
Administration–>Application Configurationmenu in theVMware Carbon Black Cloud App -
On the
VMware CBC Base Configurationtab set theVMware CBC Base IndexandVMware CBC Action Indexto the index names from step 1 e.g.carbonblackcloud -
[Optional] Configure a proxy if needed on the
Proxiestab -
If you have not already configured any API Configurations in Splunk see the Authentication & Authorization section
-
Depending on what inputs you want to configure see the corresponding section:
-
Alerts-
Data Forwarder
-
API
-
Navigate to the
Alerts Inputstab in the Application Configuration menu -
Create a new configuration by clicking the
+in the top right corner -
Enter a name for this configuration
-
Set the Minimum Severity to the desired level Default:
4 -
Select the desired Alert types Default:
All- You may see
Bothafter upgrading the app.Bothmeans CB Analytics and Watchlist alert types, the only two that were supported in App version v1.x.
- You may see
-
Select the API Token configured in the Authentication & Authorization section
Note: Ensure your Splunk access level has the permissions specified in Table 1 above for 'Alerts API' -
Select the proxy configured in step 4. Select
Noneif a proxy is not being used. -
Set Lookback to
0unless you need to retrieve data from the previous day(s) Default:7days -
Select the index equal to the Base Index name from
VMware CBC Base Configuratione.g.carbonblackcloud -
Set the Interval to the desired poll cycle Default:
300secondsNote: If your organization generates a significant amount of alerts, consider using the Data Forwarder option 11*[Optional]* Add a query to refine the alerts that will be ingested
Note: The query uses the same syntax as the search bar on the 'Alerts' page in the Carbon Black Cloud console. Example: NOT report_name:"My Noisy Report"
-
-
-
Audit Logs-
Navigate to the
Audit Log Inputstab in the Application Configuration menu -
Create a new configuration by clicking the
+in the top right corner -
Enter a name for this configuration
-
Select the API Token configured in the Authentication & Authorization section
Note: Ensure your Splunk access level has the permissions specified in Table 1 above for 'Audit Logs API' -
Select the proxy configured in step 4. Select
Noneif a proxy is not being used. -
Set the index equal to the Base Index name from
Note: Do not include 'index='VMware CBC Base Configuratione.g.carbonblackcloud -
Set the Interval to the desired poll cycle Default:
300seconds
-
-
Auth EventsAuth Events requires Enterprise EDR, and to be enabled for each policy. Read more in the Carbon Black Cloud User Guide.
- API
-
Navigate to the
Auth Events Inputstab in the Application Configuration menu -
Create a new configuration by clicking the
+in the top right corner -
Enter a name for this configuration
-
Select the Custom API Token configured in the Authentication & Authorization section
Note: Ensure your Splunk access level has the permissions specified in Table 1 above for 'Auth Events API' Note: This requires Enterprise EDR to be enabled -
Select the proxy configured in step 4. Select
Noneif a proxy is not being used. -
Set Lookback to
0unless you need to retrieve data from the previous day(s) Default:7days -
Set the index equal to the Base Index name from
Note: Do not include 'index='VMware CBC Base Configuratione.g.carbonblackcloud -
Set the Interval to the desired poll cycle Default:
Note: If your organization generates a significant amount of alerts, consider using the Data Forwarder option300seconds
-
- API
-
Live Query Results-
Navigate to the
Live Query Inputstab in the Application Configuration menu -
Create a new configuration by clicking the
+in the top right corner -
Enter a name for this configuration
-
Select the Custom API Token configured in the Authentication & Authorization section
Note: Ensure your Splunk access level has the permissions specified in Table 1 above for 'Live Query Results' -
Select the proxy configured in step 4. Select
Noneif a proxy is not being used. -
Set Lookback to
0unless you need to retrieve data from the previous day(s) Default:7days -
Select the index equal to the Base Index name from
Note: Do not include 'index='VMware CBC Base Configuratione.g.carbonblackcloud -
Set the Interval to the desired poll cycle Default:
300seconds -
Add a Result query to refine the results that will be ingested e.g.
Note: The query uses the same syntax as the 'Live Query' -> 'Query Results' page in the Carbon Black Cloud console*for all results
-
-
Vulnerabilities-
Navigate to the
Vulnerabilities Inputstab in the Application Configuration menu -
Create a new configuration by clicking the
+in the top right corner -
Enter a name for this configuration
-
Set the Minimum Risk to the desired level Default:
7 -
Select the Custom API Token configured in the Authentication & Authorization section
Note: Ensure your Splunk access level has the permissions specified in Table 1 above for 'Vulnerabilities' -
Select the proxy configured in step 4. Select
Noneif a proxy is not being used. -
Set the index equal to the Base Index name from
Note: Do not include 'index='VMware CBC Base Configuratione.g.carbonblackcloud -
Set the Interval to the desired poll cycle Default:
300seconds -
[Optional] Add a query to refine the vulnerabilities that will be ingested
Note: The query uses the same syntax as the 'Vulnerabilities' page in the Carbon Black Cloud console
-
-
Data Forwarder Input Configuration
A Data forwarder must be created in order for the Carbon Black Cloud to stream data externally. The forwarder will be responsible for routing data to an S3 bucket where it can then be taken as input by Splunk using the AWS input add-on.
Requirements
- The AWS add-on for Splunk is required for configuring inputs from an AWS source
- For each data type (Alerts and Events) you want to bring into Splunk you will need the following
- An AWS S3 bucket
- An AWS SQS queue
- A Carbon Black Cloud Data Forwarder
Create a Data Forwarder
Configure your forwarder with filters to limit the amount of event data forwarded to Splunk in order to reduce costs. The forwarder can be created via Carbon Black Cloud Console under Settings –> Data Forwarders or the Carbon Black Cloud Data Forwarder API.
- For more detailed instructions on setting up a Data Forwarder, see the Carbon Black Cloud User Guide.
- View a video of configuring the Data Forwarder & Splunk on Tech Zone.
Configure AWS Add-On
Before configuring the AWS inputs, make sure that the AWS add-on is installed in your Splunk environment. For instructions on installing the AWS add-on see the Splunk documentation.
The recommended approach to ingest Carbon Black Cloud Data Forwarder data into Splunk is the SQS-based S3 data input.
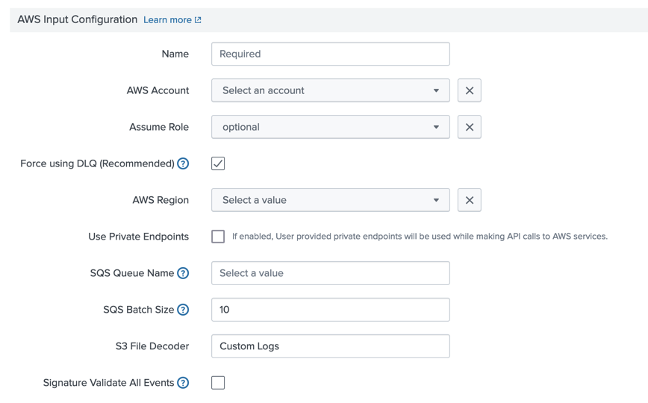
To configure an input in the AWS add-on to pull Carbon Black Cloud data using SQS-based S3:
-
Configure your AWS account on the Configuration page in the AWS Add-on
-
In the AWS Add-on, create a new input on the Inputs page by selecting
Create New input->Custom Data Type->SQS-based S3-
Specify a name that should be used for this input
-
Select the AWS account you configured with the AWS Add-on
-
[Optional] If you configured IAM roles when configuring your AWS account select the created role
-
Select the AWS Region where you configured the SQS queue and S3 bucket
-
Select the SQS queue from the dropdown
Note: If you don't see your SQS queue ensure you have selected the correct AWS region and the SQS queue was created in the region -
Set the batch size for Splunk to pull from your SQS queue Default:
10messages -
Ensure the S3 File Decoder is set to
Custom Logs -
Use one of the following Source Types depending on the data you configured for the forwarder
- Set to
vmware:cbc:s3:alertsforAlerts - Set to
vmware:cbc:s3:eventsforEvents - Set to
vmware:cbc:s3:watchlist:hitsforWatchlist Hits
Note: You will need to create separate inputs for each of Alerts, Events and Watchlist Hits - Set to
-
Ensure the index you select matches the base index configured in the VMware Carbon Black Cloud app
Note: Alerts and Event should both be configured to the base index -
UNCHECK the box “Signature Validate All Events”
-
In
Advanced Settings, you can increase the polling cycle for fetching messages from the SQS Default:300seconds
-
Support and Resources
-
Useful Queries on Tech Zone
-
Use the CB Developer Network community forum to discuss issues and get answers from other API developers in the CB Developer Network
-
Access questions and answers specific to the VMware Carbon Black Cloud app at https://answers.splunk.com. Be sure to tag your question with VMware Carbon Black Cloud Splunk App.
-
Check out the frequently asked questions and common troubleshooting.
-
Report bugs and product issues to Broadcom Support
-
View all API and integration offerings on the Developer Network along with reference documentation, video tutorials, and how-to guides.
Diagnostics Generation
Please include a support diagnostic file when creating a support ticket. Use the following command to generate the file based on which Splunk app or add-on is installed. Send the resulting file to support.
$SPLUNK_HOME/bin/splunk diag --collect=app:vmware_app_for_splunk
$SPLUNK_HOME/bin/splunk diag --collect=app:IA-vmware_app_for_splunk
$SPLUNK_HOME/bin/splunk diag --collect=app:TA-vmware_app_for_splunk
Last modified on April 29, 2024
