Threat Hunting and Incident Response Use Cases for Carbon Black Cloud App on Splunk
Posted on March 9, 2021
With the latest release of our Carbon Black Cloud App for Splunk, we’ve consolidated key features from our platform into a single integrated solution that streamlines SIEM and SOAR workflows between Splunk and the Carbon Black Cloud. In this blog, we’ll provide overviews of several key use cases that simplify and accelerate modern SOC workflows using a single pane of glass.
- Hash Banning by Certificate
- Prevention based on MITRE Attack Behaviors
- Identifying and Mitigating Malicious PowerShell Activity
- Automated Mitigation of Exploitable Vulnerabilities
- Using Live Query to Enrich LSASS Scraping Investigations
These use cases can be achieved within the Splunk console using the Carbon Black Cloud App for Splunk and can also be implemented and extended through dedicated SOAR platforms, including Splunk Phantom. Using the latest Splunk App, SOC analysts can leverage built-in Alert Actions to automate these and other use cases without investing in a full SOAR platform.
Hash Banning by Certificate & Publisher
Hash banning is a powerful feature that can shut down malicious and other unwanted software executing in your environment. The problem most analysts encounter with traditional hash banning solutions is the need to play “catch-up” when updates are made to these tools and the hashes change.
Using the Carbon Black Cloud App for Splunk, hash banning workflows can be automated and managed through a single pane of glass. With the latest release of the Splunk App, analysts are now able to automatically ban hashes based on alerts generated by watchlist telemetry; this means that if a watchlist is created to detect software signed by specific publisher (or if the binary contains certain metadata), the Splunk app can automatically ban any hash that triggers this alert via the Carbon Black Cloud API. This workflow virtually eliminates the tedious game of hash banning “whack-a-mole" even before it starts.
This workflow can be used, for example, to automate the remediation of torrenting software by creating a watchlist to detect binaries published by BitTorrent (eg: process_publisher:"BitTorrent, Inc.") or with “uTorrent” as the file descriptor (eg: process_file_description:"uTorrent"). When Carbon Black detects a process matching the malicious publisher (BitTorrent, in this case), an alert will be sent from the Carbon Black Cloud to Splunk. Using built-in Alert Actions in the latest Splunk app, analysts can automate the remediation process leveraging multiple endpoint actions, including:
- Killing the process
- Banning the hashes
- Move the system into a stronger prevention policy.
Prevention based on MITRE Attack Behaviors
It a worthwhile use case to note that one can create alerts for a specific MITRE TID using the Splunk App to alert on specific TTPs in the “threat_indicators{}.ttps{}” array. Splunk can then automatically take preventative action on specific alerts using the Carbon Black API integration such as:
- Killing the process
- List active RDP sessions
- Collect Event Logs
- Move the system into a stronger prevention policy
- Quarantine the Endpoint
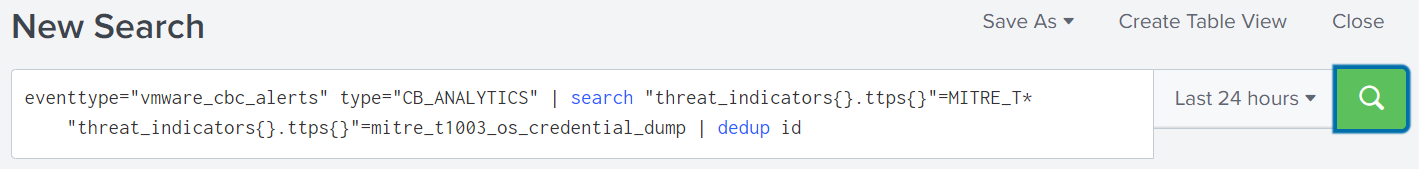
An example of this would be setting an alert for MITRE T1003 (OS Credential Dumping)
One would create a search in Splunk for the alert containing the desired TID (as shown below).
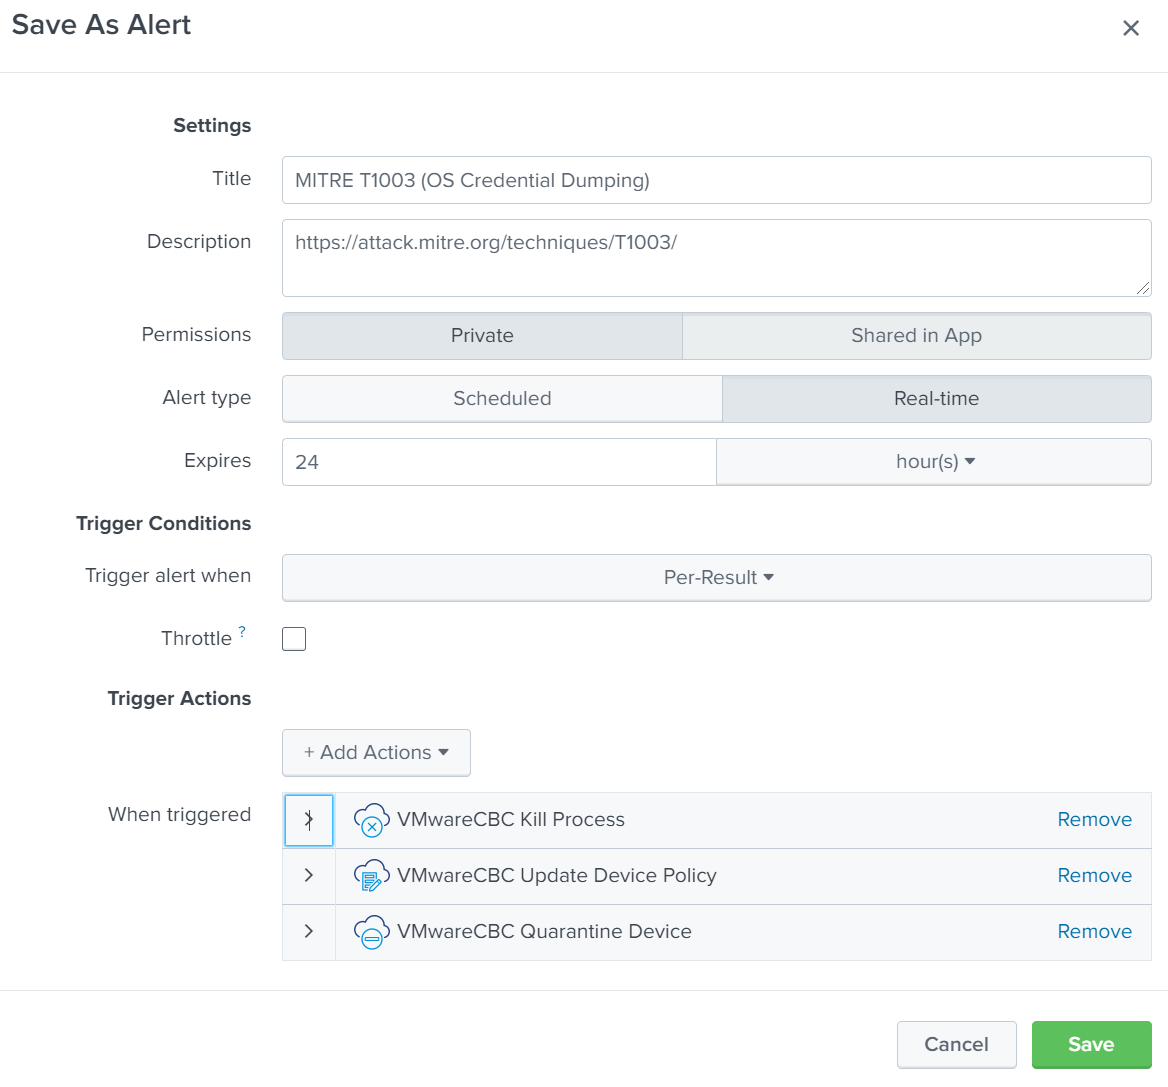
Once the search has been created, simply select Save As –> Alert and configure an alert (shown below).
Identifying and Mitigating Malicious PowerShell Activity
While PowerShell is a useful tool in many scenarios, it can also be leveraged to compromise an environment by enabling attackers to “live off the land”. In this use case, we’ll show how watchlists can be used in the Carbon Black Cloud App for Splunk to detect and investigate specific behaviors that could indicate PowerShell being used maliciously.
Detecting trusted applications being used for malicious purposes is a challenge that requires more context than typically required for a malware-only attack. By leveraging the Live Response Alerts Framework within the Splunk App analysts can automate the collection of artifacts associated with high severity events and expedite the overall investigation and triage workflows.
This can be accomplished by leveraging the latest Splunk App with a Carbon Black Cloud watchlist configured to detect specific PowerShell parameters. When a detection is made based on the watchlist and generates an alert, the alert can be configured in the Splunk App to trigger the collection of specific artifacts to add context to the investigation. These artifacts include all running processes, logged on users, active RDP network connections, enriched events, and event logs. The automated workflow can also be configured to move the system into an Advanced Security Policy to provide additional protection while the analyst investigates.
An example of this would be when PowerShell is detected running with the “Invoke-Expression” parameter (process_name:powershell.exe AND (process_cmdline:"IEX" OR process_cmdline:"Invoke-Expression"), Alerts could be configured to:
- Collect a list of all running processes
- Collect all logged-on users · Collect active RDP network connections
- Collect all enriched events
- Collect the event logs
- Move the system into an Advanced Security Policy.
Automated Mitigation of Exploitable Vulnerabilities
As we’ve seen in recent SolarWinds supply chain attacks (SUNBURST and SUPERNOVA), even software patches are not impervious to compromise. When an exploit is released into the wild, there is often a gap (for testing and approvals) between when the vulnerability is disclosed and when it is patched. This presents a window of opportunity for attackers to exploit the vulnerability. Security teams must be vigilant to tightly monitor and defend their environment during this time before the vulnerability is mitigated when the patch is deployed.
By creating watchlists in the Carbon Black Cloud using the Carbon Black Cloud App for Splunk, analysts can monitor for specific behaviors associated with the exploit, and orchestrate a remediation workflow that will automatically trigger if the behavior is detected.
One example of this would be to create a watchlist to detect malicious behavior associated with SolarWinds. Checkout the Carbon Black TAU-TIN REPORT: SolarWinds SUNBURST / Solarigate Incident. By configuring Alert Actions in the Splunk App, an automated workflow can kick off to stop this attack by:
- Quarantine the device
- Collect event logs
- Move the system into a higher level of enforcement
- Query the environment to determine other systems with similar Struts packages installed
Using Live Query to Enrich LSASS Scraping Investigations
The Carbon Black Cloud App for Splunk integrates all alerts provided in the Carbon Black Cloud console directly into Splunk dashboards and automated workflows.
When an analyst receives an alert generated by Carbon Black Cloud Endpoint Standard (NGAV) that could indicate credential theft, such as memory scraping of a system process, their next questions are likely:
- Was the memory scraping attempt successful?
- Who was logged in at the time?
The first is easy to answer - by looking for the sensor_action field associated with the alert, and you should find the attempt was denied or terminated by the Carbon Black Cloud’s prevention capabilities.
This should normally be the case, but there are always exceptions, such as systems in your environment where someone has relaxed the policy. Now you need to know exactly who was signed in at the time, as their credentials may have been compromised. Live Query was built to do just that - provide on-demand access endpoint data in real-time. In this case, Live Query can be used to gather the latest logged on users and other relevant information from a specific endpoint or the entire environment.
If this alert goes unattended for hours or days, it might be too late! That’s why leveraging SOAR capabilities is critical to any SOC – it saves analysts valuable time, ensures the same process is followed every time, gathers the most relevant information, and is low risk. Using the latest Carbon Black Cloud for Splunk App, analysts have access to streamlined automation and orchestration capabilities using built-in Live Query and Response actions.
Let’s put it all together:
- Configure the CBC Alerts and Live Query inputs
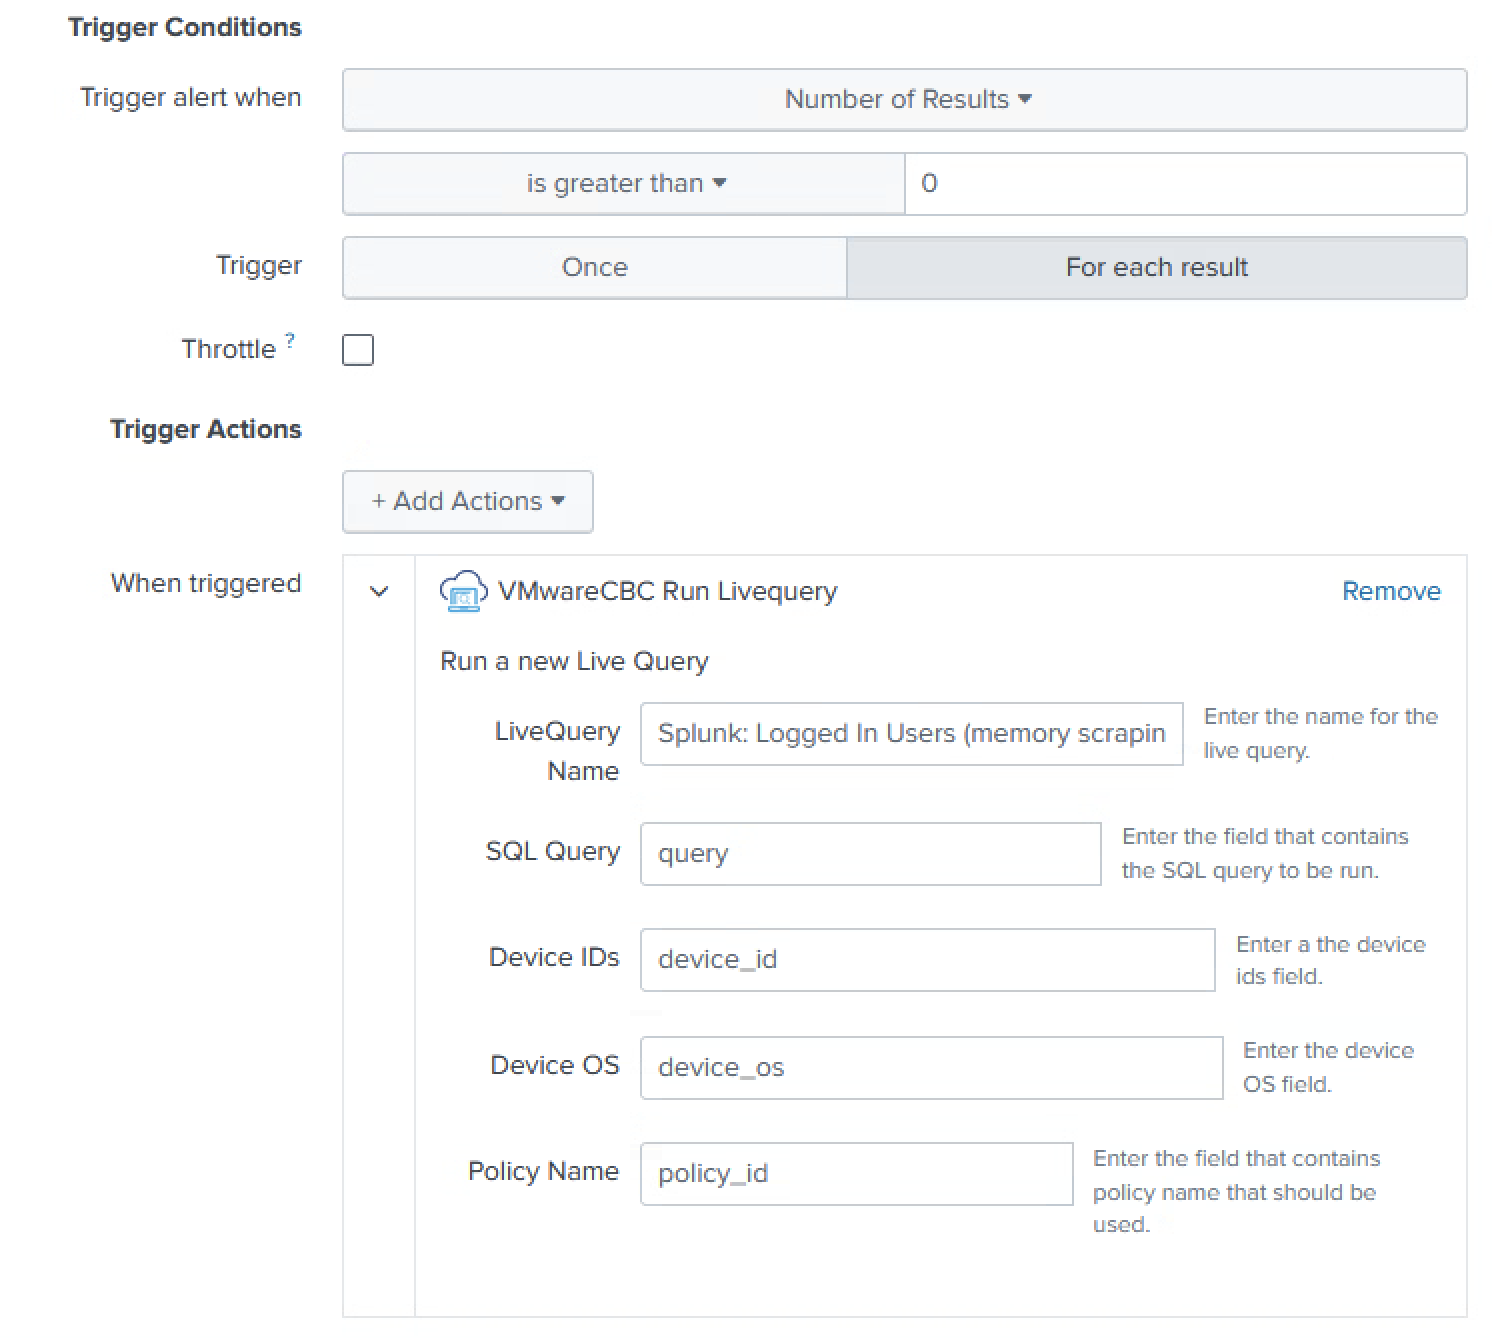
- Run a Splunk Alert every 5 – 15 minutes, querying for CBC alerts with TTPs such as
READ_SECURITY_DATA,DUMP_PROCESS_MEMORY, andMITRE_T1003_OS_CREDENTIAL_DUMP. - For each unique device, run a new Live Query to get logged in users
- You could also add parameters to your search to remove any CBC alerts with a
sensor_actionofDENY/TERMINATE
- You could also add parameters to your search to remove any CBC alerts with a
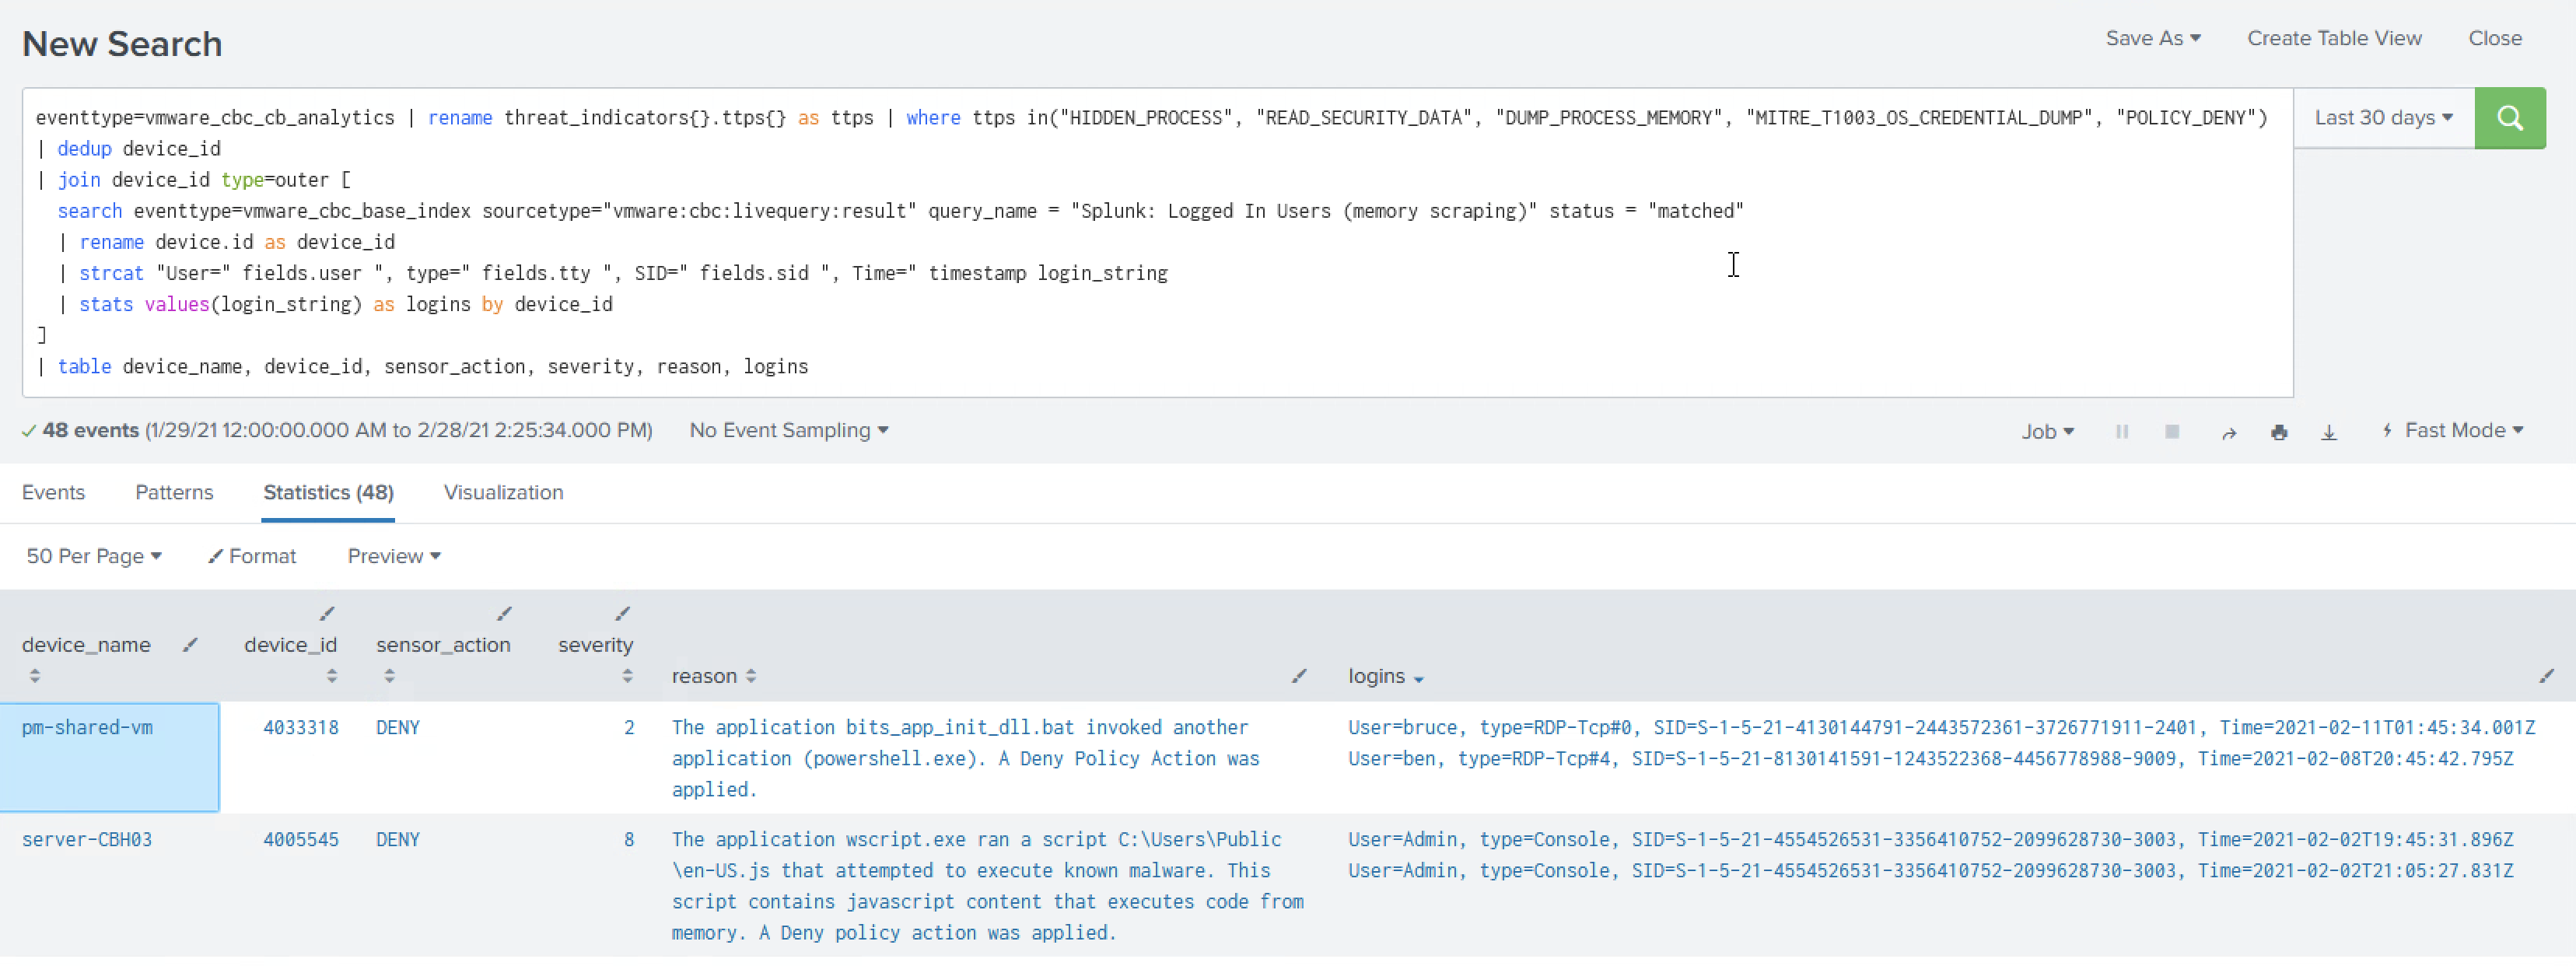
- Join together the alerts and Live Query results by the
device_idfield- I’ve done some string manipulation to highlight a few of the fields that are available
At this point, an analyst has what they need to determine if immediate action should be taken, such as resetting the user’s password. This step could also be automated, especially if your Identity and Access Management solution can force a user to ask for MFA.
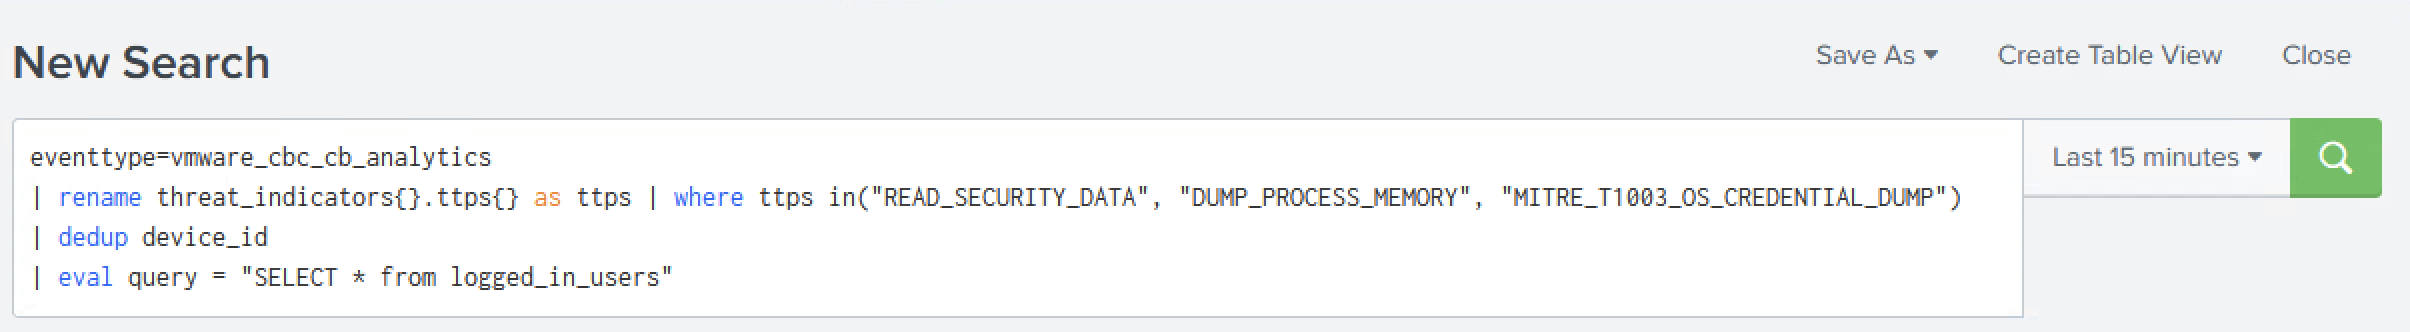
eventtype=vmware_cbc_cb_analytics
| rename threat_indicators{}.ttps{} as ttps
| where ttps in("READ_SECURITY_DATA", "DUMP_PROCESS_MEMORY", "MITRE_T1003_OS_CREDENTIAL_DUMP")
| dedup device_id
| eval query = "SELECT * from logged_in_users"
eventtype=vmware_cbc_cb_analytics
| rename threat_indicators{}.ttps{} as ttps
| where ttps in("READ_SECURITY_DATA", "DUMP_PROCESS_MEMORY", "MITRE_T1003_OS_CREDENTIAL_DUMP")
| dedup id
| join device_id type=outer [
  search eventtype=vmware_cbc_base_index sourcetype="vmware:cbc:livequery:result" query_name = "Splunk: Logged In Users (memory scraping)" status = "matched"
  | rename device.id as device_id
  | strcat "User=" fields.user ", type=" fields.tty ", SID=" fields.sid ", Time=" timestamp login_string
  | stats values(login_string) as logins by device_id
]
| table device_name, device_id, sensor_action, severity, reason, logins
Questions and comments about the Carbon Black Cloud App for Splunk can be posted in the Developer Network Forum on the User Exchange.
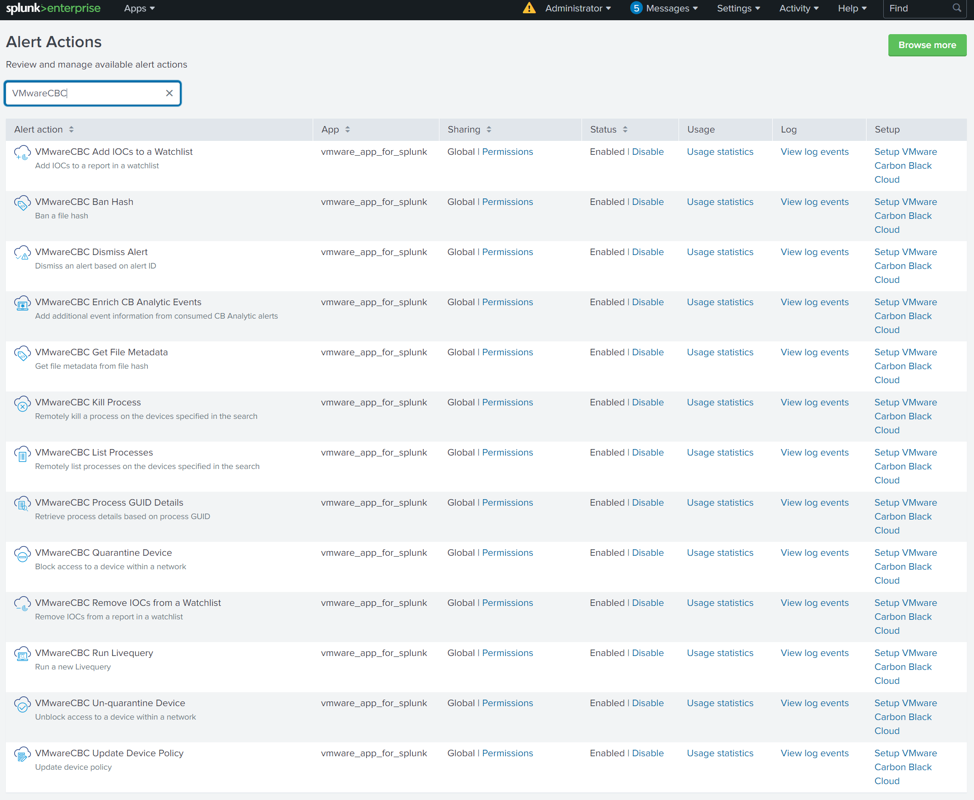
CBC Splunk App Alert Actions
Below is a list of all the Alert Actions built into the CBC Splunk App. Find more information about Alert Actions on the Details tab here.